(Reconstruction, Simplification, Smoothing, Meshing, Results)
Suppose you had access to a 3D scanner or sets of CT or MRI scans and you wanted to visualize 3D models. Then the goal is to build a 3D model from pre-segmented points, where each point represents one region or material. We want the model to represent the shape accurately yet be as simple as possible. If we wanted to analyze the model using finite elements, then we also need a high-quality model that is water-tight and topologically correct. No overlaps or gaps would be allowed. Around 2005, most systems only considered one material or region, so our multiple-region computational geometry efforts were innovative at the time. Let us consider four major steps in a pipeline and then view some simple results.
1. Reconstruction
The specific regions within each 2D scan were previously identified using image processing. The point sets (scans) were aligned using Procrustes procedures. The first major step is to reconstruct a 3D model from the layers of point sets. For point sets that started with a rectangular grid, we formed cubes (voxels) using eight vertices, as shown in Figure 1. For efficiency, we processed strips of voxels and progressed in one direction.

Fig. 1 Reading new strips and voxels.
Each cube (voxel) was divided into six tetrahedra as shown in Figure 2.

Figure 2 . Voxel divided into six tetrahedra.
Each tetrahedron is further subdivided into regions based on a generally classed (multiple region) method of marching-tetrahedra. Marching Tetrahedra has advantages over Marching Cubes in that there are fewer separation surfaces and no topological ambiguities. The result is a collection of triangles that form a 3D boundary representation (B-rep) of the multiple-region model. The regions are water-tight and have no interferences or gaps.

Figure 3. Separation face that separates a tip of a tetrahedron.
2. Simplification
A common challenge is that there are far too many triangles in the B-rep model. Simplification (also called decimation) is used to reduce the number of triangles in the model, say down to 10%. The Quadric based method from Garland and Heckbert was used as a basis for our simplification. Their scheme preserves the shape of the models by eliminating edges that have the lowest impacts on the shape. We generalized the method by using multiple-region edge and triangle data structures and by adding extra tests that:
• Ensure triangles do not fold over themselves.
• Prevent pinched corners that produce zero-volume slivers.
• Reject removals that would split or join regions.
• Uphold the Euler Poincare Characteristic, which is a fancy way to say that the models remain topologically correct and consistent. For example, no holes are created or removed.
• Reject removals that would result in valid, but poor triangle shapes.
In short, our simplification goal was to reduce the number of triangles in the model, while still maintaining the same shape and topology. An example result is shown in Figure 4, where a polycrystalline block was simplified down to 25% of the number of triangles. The final shapes match the original shapes with fewer triangle facets.
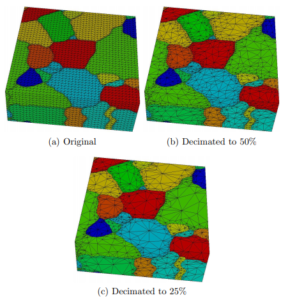
Figure 4. Simplification of a Polycrystalline Model.
The restriction on poor shape triangle shape quality is seen in Figure 5, where the lack of a quality restriction produced needles and obtuse triangles. Enforcing quality produced triangles that tend to become closer to being equilateral, even if equilateral is not the exact quality criterion. See Shewchuck for a more detailed explanation on mesh quality and what good shapes look like. We should mention that poor quality elements can produce poor finite element results, so we maintained the shape quality at all steps.
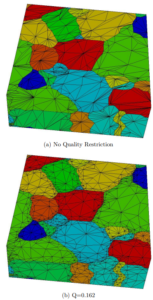
Figure 5. Restricted Decimation to Enhance Face Quality
M. Garland and P. Heckbert, “Surface Simplification Using Quadric Error Metrics,” SIGGRAPH 97 Conference Proceedings, Annual Conference Series, ACM SIG-GRAPH, Addison Wesley, Aug. 1997.
Jonathan R Shewchuck. What is a good linear element? interpolation, conditioning, and quality measures. In Eleventh International Meshing Roundtable, 2002.
3. Smoothing
To remove stair steps and jagged features, we use a volume preserving filter by Taubin that is a bi-directional Laplacian filter, as shown in Figure 6. As expected, the smoothing procedure was modified to respect multiple regions, preserve topology, and maintain good triangle shape. We took special care when smoothing along triple junctions to preserve edges, rather than rounding them over.

Figure 6. Smoothing of a Grain.
Gabriel Taubin. A signal processing approach to fair surface design. Computer Graphics, 29(Annual Conference Series):351–358, 1995.
4. Meshing
The B-rep models were converted to finite element meshes using an open-source program called TetGen (see the H. Si reference below). In 2005, the meshing community still struggled with building quality meshes, so it was advantageous to start with high quality B-rep models. As shown in Figure 7, the number of poor shaped elements was lower when the shape quality restrictions were applied. However, some poorly shaped elements were still seen in the final meshes.
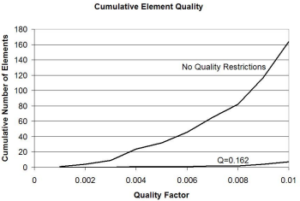
Figure 7. Number of Poor Tetrahedra Versus Quality Level.
H. Si. On refinement of constrained delaunay tetrahedralizations. Proceedings of the 15th International Meshing Roundtable, September 2006, 2006. http://tetgen.berlios.de.
5. Results
A simple finite element analysis is shown in Figure 8 for a nickel-based superalloy subjected to tension. The initial mesh is shown on the left, the outside stresses are shown in the middle, and the higher internal stresses are illustrated on the right. We used VTK to illustrate the results.
Although it is outside the scope of this blog item, the “finite element” stress analysis was actually performed by a Natural Element Method (NEM) that handles poorly shaped elements. Recall in Figure 7 that we still had poorly shaped elements, so we needed to use a tool that would provide accurate and stable results.
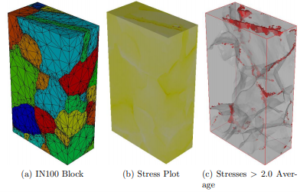
Figure 8. Uniaxial Tension
More details about the Natural Element Method can be found in the following paper.
“Reconstruction and Simplification of High-Quality Multiple-Region Models from Planar Sections,” Engineering with Computers, Volume 25, Issue 3, pp 221–235, with S. Saigal and G.S. Rohrer, Sept. 2009.