 ViewRolls
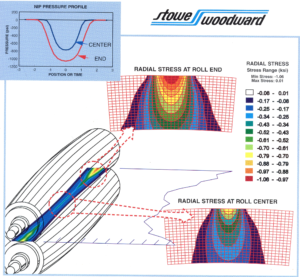
Communicating profile data is usually performed using 2D plots in Excel. I wanted to use a stronger visual approach and to superimpose the profiles onto pictures of the rolls to make it clear that the rolls were being subjected to nonuniform loading and pressures. For the example shown on the left, the contact pressure distribution is shown by the colored “3D” contour plot embedded between the rolls. The loading distribution is projected out of the nip in the same direction as the sheet travel. I think this approach brings the nonuniform distributions to life. Graphics design firms have used some of my images as part of their marketing materials.
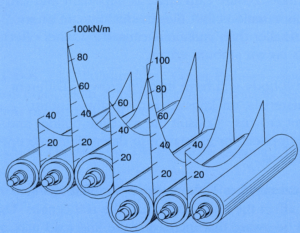 For some machines, simple line drawings communicate clearly and color is not needed, especially for journal papers. The Gate Roll Size Press shown on the left is an example where color is not necessary, since we want to emphasize the undercrowned loading profiles for each nip. We attempted to convince the customer that the rolls needed larger crown amounts, and the results seem clear enough.
 For other studies, color can be used to distinguish multiple results. For the example shown on the left, the line load is shown in red and the resulting sheet solids are shown in blue. Without color, the lines would look far too busy and confusing. For this study, we showed that loading variations produced sheet solids variations.
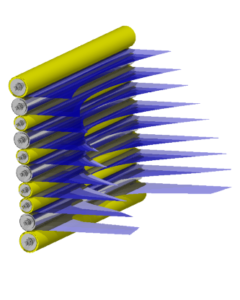 Another study where color is important is for supercalender stacks where yellow indicates a covered roll, and metallic color indicates a bare metal roll. The line loads were shown in semi-transparent blue so that we could see more than one nip profile at a time. This particular example was for a simulation of the consequences after a major machine malfunction. The extremely high end loads are extremely undesirable. We believed we needed decent graphics to be taken more seriously.
The ViewRolls program ranks as one of the most fun programs I have developed in my career. It uses fully object oriented C++ and starts with a basic shape object class and then derives shapes that become more and more specific and complex. This is one of the best matches I have seen between OOP and a subject matter. Using OOP, the rolls could be crowned, and the bending was estimated using beam theory.
Since the paper industry uses only a small set of cluster arrangements, we could make a user interface that started with a cluster type, say a calender stack or a 4-roll press. Then we add the roll lengths and diameters of the rolls along with the angles between the rolls. Typical defaults were provided, so hand-input dimensions are optional. The user also inputs the nip profiles that were obtained from the NipProfiler or SMARTRolls. The program then provides a quick wire mesh of the results and geometry so the user can scale the nips and rotate the cluster to get a clearer and convincing view. Afterwards, the picture may be exported in a variety of formats, but I recall using DXF in early analyses. Originally, I rendered the results using CorelDream that was derived from RayDream. Up until this point, I had developed the software at night for fun. However, after showing some results at a national sales meeting, my employer asked that we send the source code to a consultant to get a Windows GUI and automatic OpenGL rendering. The consultant led me to believe that he also had fun advancing the software. Please note that I developed this software around 1995. Today, it would be more efficient to find a solid modeling package and simply write scripts to generate models.