 CrownCalc
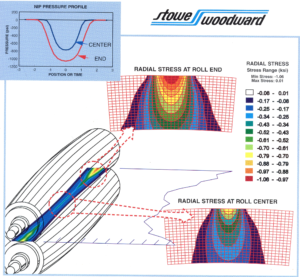
Paper mill rolls rarely have the proper shapes needed to produce uniform loading profiles. For a given set of loads, there is one set of crown shapes that produce uniform loading. Quite often, the operators run at loads that differ from the designed load, so the pressure uniformity suffers. CrownCalc is a nonlinear contact finite element program that estimates the consequences of incorrect shapes or loads. For the undercrowned case shown on the left, the ends are loaded more heavily than the center, as shown by the red regions in the contour plot between the rolls. The roll cover (coating) stresses will also be different between the ends and center, as shown by the contour plots on the meshes or the 2D plot in the upper left hand corner. I wrote CrownCalc and published a paper to provide teaching tools to promote better uniformity during the paper making process.
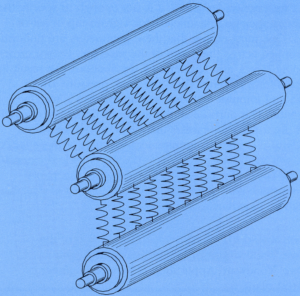
 Under the hood, rolls are separated by nonlinear springs, as shown to the left.
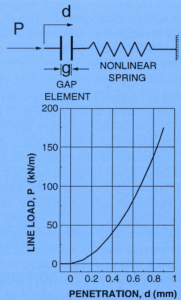
Each individual spring is modeled with a gap element and an nonlinear load vs. deflection curve, as shown on the right. I obtained the spring performance by a different finite element program, called NipCalc. The final finite element program is then nonlinear and 3D and requires an iterative and stable solution scheme.
 Fortunately, was had a few sets of experiments to validate the model. While the results are not perfect, we are fairly close and believe we are on the right track for the case shown on the left.
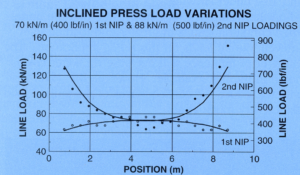
 We simulated a Gate Roll Size Press, as shown on the left, for the case where all the nips were undercrowned. The operators are in a bit of a difficult situation here, since the paper coating thickness does depend on the loads, so they sometime increase the loads as a control variable. What we show here, clearly, is that the higher loads result in greater loading on the ends compared to the center.
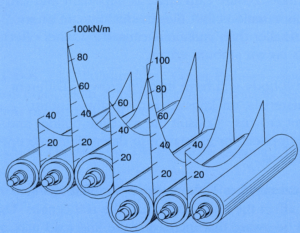
 One of the most effective teaching tools is to show a plot where a flat and uniform nip is obtained at some line load, say 100 kN/m. If the operator were to increase the load 10%, the load on the ends increases about 30% and the loading in the center barely changes at all. These types of graphs show that operation settings are not always consistently applied everywhere. The roll cover engineers can also instruct the customer concerning safe operational guidelines, say keep it within 2% of the design load. Non-uniform loading produces non-uniform sheet properties, non-uniform moisture profiles, and increased wear of the roll covers and press felts. There can be a significant increase in energy costs when the loads are not uniform.
In terms of software, this code had two modules, a DOS console C++ engine that accepted input files and a Windows C++ MFC GUI as the user interface. Most commercial finite element packages could perform contact analyses like these, but the custom approach had distinct advantages. First, the models could be input by non-finite element practitioners. The users know the roll dimensions and loads, but may not know how to perform solid modeling. Second, the nonlinear springs would be difficult to automate in a commercial package. Third, The execution times generally were faster than the commercial models, since we have a highly specific case. Fourth, the cost to develop this program and to support 100 users would be far cheaper than purchasing 100 seats of a commercial package.
“Crowns and Cross-Machine Loading Variations,” TAPPI Journal, Vol. 80, No. 4, April 1997, p. 219. Also presented at the 1995 TAPPI Engineering Conference, September, 1995.